此文由 Mix Space 同步更新至 xLog
为获得最佳浏览体验,建议访问原始链接
https://www.do1e.cn/posts/citelab/GPUmonitor
前言#
这篇博客记录了演进过程,缺少参考价值。建议直接查看下述项目并使用 docker 快速部署。
Github Repo not found
The embedded github repo could not be found…
Github Repo not found
The embedded github repo could not be found…
效果图:
| Light | Dark |
|---|---|
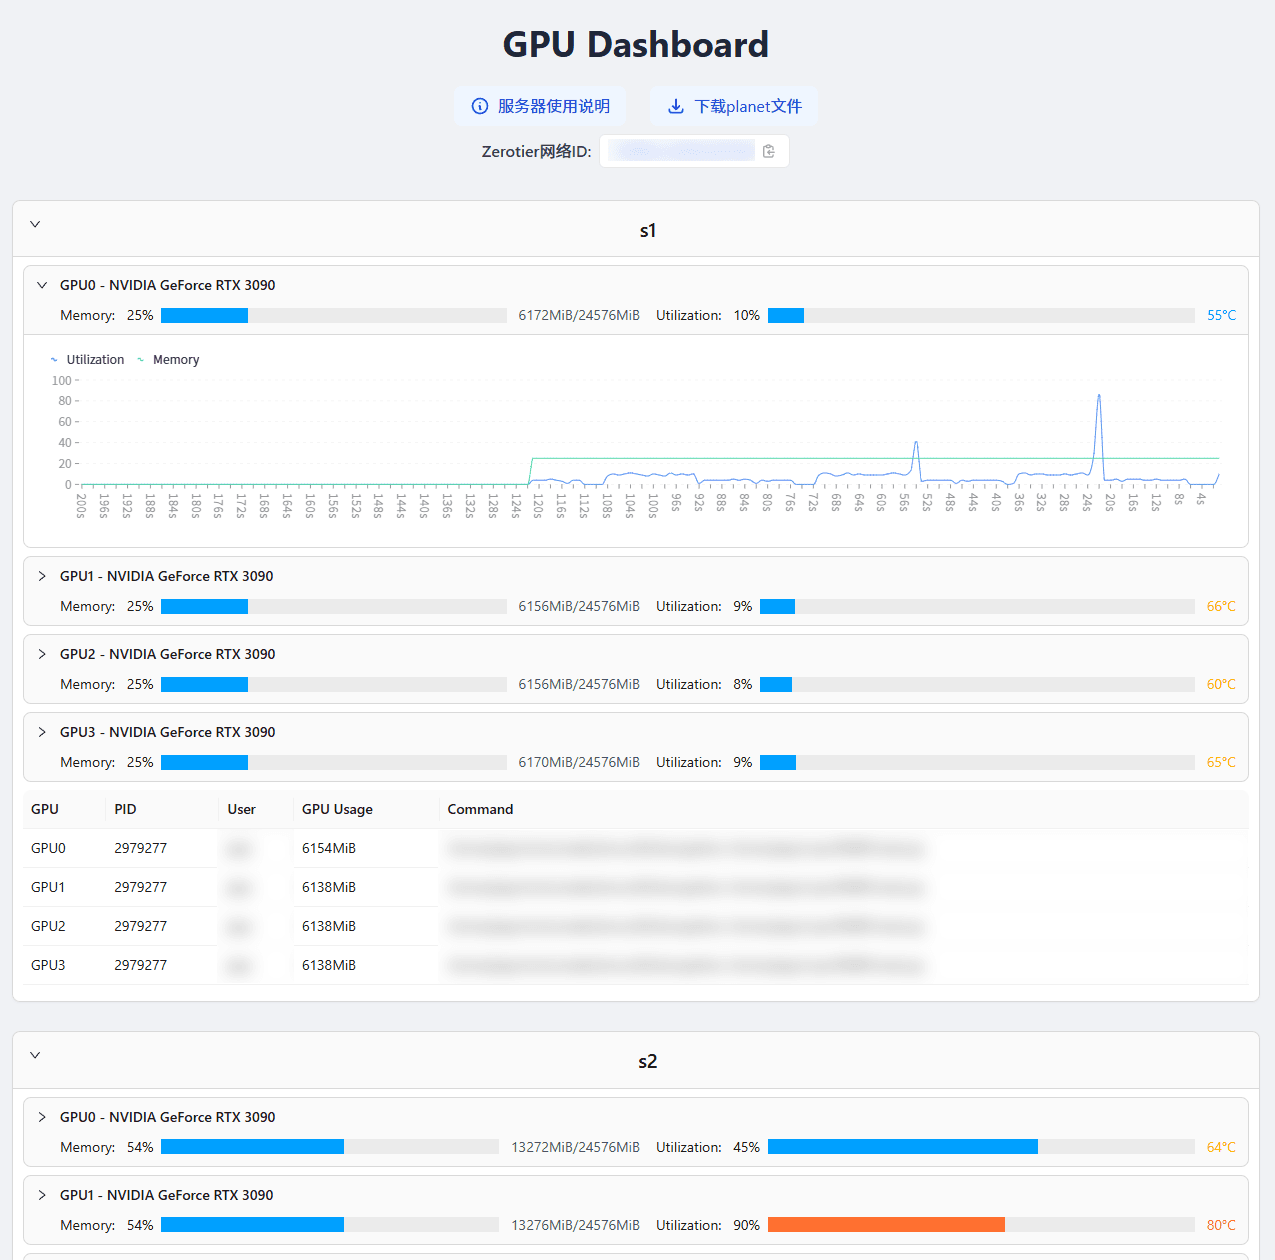 | 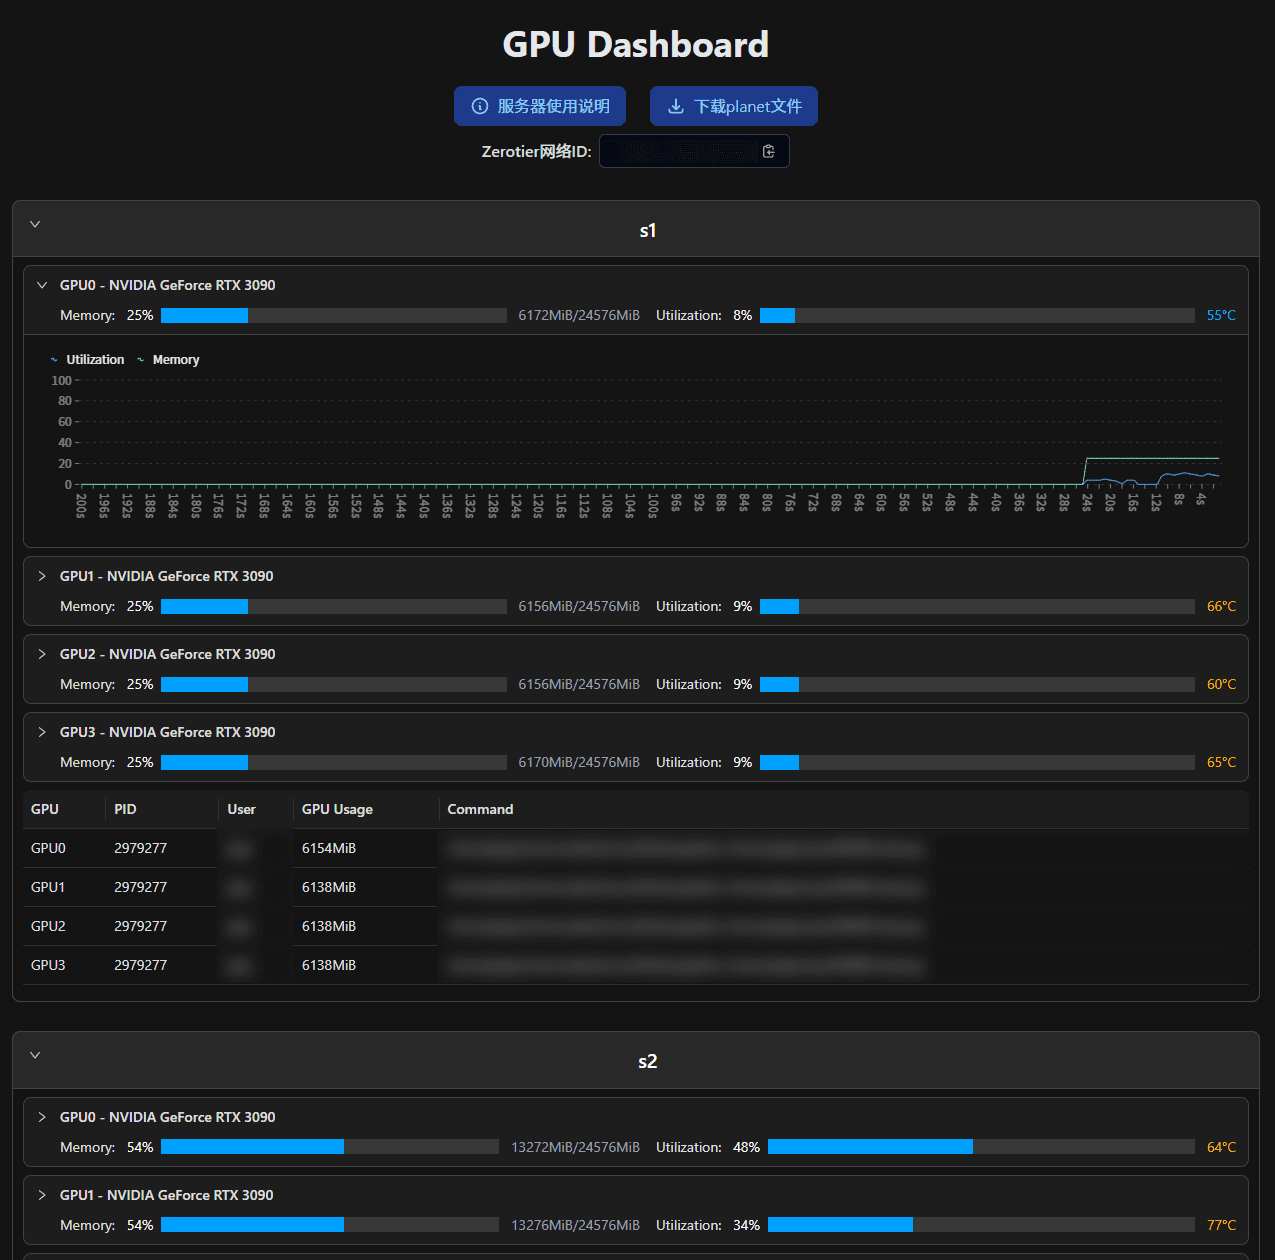 |
旧方案:ssh 获取 nvidia-smi 输出#
之前的前端经验停留在使用 Python 生成 html,因此用我的小主机配置了一个 GPU 监控方案:
- 通过 ssh 命令获取 nvidia-smi 的输出,并将显存占用等信息从中解析出来。
- 根据占用 GPU 进程的 pid,通过 ps 命令获取用户和命令。
- 使用 Python 将上述信息输出为 markdown,并通过Markdown输出为 html。
- 配置 cron 每分钟执行上述步骤,在 nginx 中配置网页 root 为 html 所在目录。
对应的代码如下:
# main.py
import subprocess
from copy import deepcopy
import json
from markdown import markdown
import time

from parse import parse, parse_proc
from gen_md import gen_md

num_gpus = {
    "s1": 4,
    "s2": 4,
    "s3": 2,
    "s4": 4,
    "s5": 5,
}


def get1GPU(i, j):
    cmd = ["ssh", "-o", "ConnectTimeout=2", f"s{i}", "nvidia-smi", f"-i {j}"]
    try:
        output = subprocess.check_output(cmd)
    except subprocess.CalledProcessError as e:
        return None, None
    ts = int(time.time())
    output = output.decode("utf-8")
    ret = parse(output)
    processes = deepcopy(ret["processes"])
    ret["processes"] = []
    for pid in processes:
        cmd = [
            "ssh",
            f"s{i}",
            "ps",
            "-o",
            "pid,user:30,command",
            "--no-headers",
            "-p",
            pid[0],
        ]
        output = subprocess.check_output(cmd)
        output = output.decode("utf-8")
        proc = parse_proc(output, pid[0])
        ret["processes"].append(proc)
        ret["processes"][-1]["pid"] = pid[0]
        ret["processes"][-1]["used_mem"] = pid[1]
    return ret, ts


def get_html(debug=False):
    results = {}
    for i in range(1, 6):
        results_per_host = {}
        for j in range(num_gpus[f"s{i}"]):
            ret, ts = get1GPU(i, j)
            if ret is None:
                continue
            results_per_host[f"GPU{j}"] = ret
        results[f"s{i}"] = results_per_host
    md = gen_md(results)

    with open("html_template.html", "r") as f:
        template = f.read()
        html = markdown(md, extensions=["tables", "fenced_code"])
        html = template.replace("{{html}}", html)
        html = html.replace(
            "{{update_time}}", time.strftime("%Y-%m-%d %H:%M", time.localtime())
        )
    if debug:
        with open("results.json", "w") as f:
            f.write(json.dumps(results, indent=2))
        with open("results.md", "w", encoding="utf-8") as f:
            f.write(md)
    with open("index.html", "w", encoding="utf-8") as f:
        f.write(html)


if __name__ == "__main__":
    import sys

    debug = False
    if len(sys.argv) > 1 and sys.argv[1] == "debug":
        debug = True
    get_html(debug)
# parse.py
def parse(text: str) -> dict:
    lines = text.split('\n')
    used_mem = lines[9].split('|')[2].split('/')[0].strip()[:-3]
    total_mem = lines[9].split('|')[2].split('/')[1].strip()[:-3]
    temperature = lines[9].split('|')[1].split()[1].replace('C', '')
    used_mem, total_mem, temperature = int(used_mem), int(total_mem), int(temperature)

    processes = []
    for i in range(18, len(lines) - 2):
        line = lines[i]
        if 'xorg/Xorg' in line:
            continue
        if 'gnome-shell' in line:
            continue
        pid = line.split()[4]
        use = line.split()[7][:-3]
        processes.append((pid, int(use)))
    return {
        'used_mem': used_mem,
        'total_mem': total_mem,
        'temperature': temperature,
        'processes': processes
    }

def parse_proc(text: str, pid: str) -> dict:
    lines = text.split('\n')
    for line in lines:
        if not line:
            continue
        if line.split()[0] != pid:
            continue
        user = line.split()[1]
        cmd = ' '.join(line.split()[2:])
        return {
            'user': user,
            'cmd': cmd
        }
# gen_md.py
def per_server(server: str, results: dict) -> str:
    md = f'# {server}\n\n'
    for gpu, ret in results.items():
        used, total, temperature = ret['used_mem'], ret['total_mem'], ret['temperature']
        md += f'<div class="oneGPU">\n'
        md += f'    <code>{gpu}: </code>\n'
        md += f'    <div class="g-container" style="display: inline-block;">\n'
        md += f'        <div class="g-progress" style="width: {used/total*100}%;"></div>\n'
        md += f'    </div>\n'
        md += f'    <code>  {used:5d}/{total} MiB  {temperature}℃</code>\n'
        md += '</div>\n'
    md += '\n'
    if any([len(ret['processes']) > 0 for ret in results.values()]):
        md += '\n| GPU | PID | User | Command | GPU Usage |\n'
        md += '| --- | --- | --- | --- | --- |\n'
        for gpu, ret in results.items():
            for proc in ret['processes']:
                md += f'| {gpu} | {proc["pid"]} | {proc["user"]} | {proc["cmd"]} | {proc["used_mem"]} MB |\n'
    md += '\n\n'
    return md

def gen_md(results: dict) -> dict:
    md = ''
    for server, ret in results.items():
        md += per_server(server, ret)
    return md
这个方案有几个很明显的缺点,更新频率较低,并且完全依赖后端更新,无论有没有人访问都要不停地刷新数据。
新方案:前后端分离#
其实一直想实现一个前后端分离的 GPU 监控,每个服务器上运行一个fastapi,有请求时就返回所需的数据。最近开发的南哪充电让我有了信心去开发一个前端,从 api 中获取数据并渲染在页面上。
fastapi 后端#
最近无意间发现nvitop是支持 Python 调用的,原来一直以为只能通过命令可视化数据来着。
挺好,这样就能更加方便地获取所需的数据了,代码量大幅降低! (・̀ ω・́)✧
不过有一个麻烦的问题是我们实验室的服务器是在路由器下的,而路由器并不在我的控制下,端口只转发了 ssh 的。
这里我选择了使用frp,将每个服务器的 API 端口映射到我校内的小主机上。正好我的小主机配置了不少 web 服务,也方便通过域名访问 API。
之前傻掉了,其实完全可以使用 ssh (ssh -fN -L 8000:localhost:8000 user@ip) 进行端口映射,这样就可以用删除代码中的 frp 相关内容,使用 docker 启动 web 端也会更加容易。
# main.py
from fastapi import FastAPI, Request
from fastapi.middleware.cors import CORSMiddleware
from fastapi.middleware.gzip import GZipMiddleware
from fastapi.responses import JSONResponse
import uvicorn
from nvitop import Device, bytes2human
import os
import asyncio
from contextlib import asynccontextmanager

suburl = os.environ.get("SUBURL", "")
if suburl != "" and not suburl.startswith("/"):
    suburl = "/" + suburl
frp_path = os.environ.get("FRP_PATH", "/home/peijie/Nvidia-API/frp")
if not os.path.exists(f"{frp_path}/frpc") or not os.path.exists(
    f"{frp_path}/frpc.toml"
):
    raise FileNotFoundError("frpc or frpc.toml not found in FRP_PATH")


@asynccontextmanager
async def run_frpc(app: FastAPI): # frp穿透到我的校内小主机
    command = [f"{frp_path}/frpc", "-c", f"{frp_path}/frpc.toml"]
    process = await asyncio.create_subprocess_exec(
        *command,
        stdout=asyncio.subprocess.DEVNULL,
        stderr=asyncio.subprocess.DEVNULL,
        stdin=asyncio.subprocess.DEVNULL,
        close_fds=True,
    )
    try:
        yield
    finally:
        try:
            process.terminate()
            await process.wait()
        except ProcessLookupError:
            pass


app = FastAPI(lifespan=run_frpc)

app.add_middleware(GZipMiddleware, minimum_size=100)
app.add_middleware(
    CORSMiddleware,
    allow_origins=["*"],
    allow_credentials=True,
    allow_methods=["*"],
    allow_headers=["*"],
)


@app.get(f"{suburl}/count")
async def get_ngpus(request: Request):
    try:
        ngpus = Device.count()
        return JSONResponse(content={"code": 0, "data": ngpus})
    except Exception as e:
        return JSONResponse(
            content={"code": -1, "data": None, "error": str(e)}, status_code=500
        )


@app.get(f"{suburl}/status")
async def get_status(request: Request):
    try:
        ngpus = Device.count()
    except Exception as e:
        return JSONResponse(
            content={"code": -1, "data": None, "error": str(e)}, status_code=500
        )

    idx = request.query_params.get("idx", None)
    if idx is not None:
        try:
            idx = idx.split(",")
            idx = [int(i) for i in idx]
            for i in idx:
                if i < 0 or i >= ngpus:
                    raise ValueError("Invalid GPU index")
        except ValueError:
            return JSONResponse(
                content={"code": 1, "data": None, "error": "Invalid GPU index"},
                status_code=400,
            )
    else:
        idx = list(range(ngpus))
    process_type = request.query_params.get("process", "")
    if process_type not in ["", "C", "G", "NA"]:
        return JSONResponse(
            content={
                "code": 1,
                "data": None,
                "error": "Invalid process type, choose from C, G, NA",
            },
            status_code=400,
        )
    try:
        devices = []
        processes = []
        for i in idx:
            device = Device(i)
            devices.append(
                {
                    "idx": i,
                    "fan_speed": device.fan_speed(),
                    "temperature": device.temperature(),
                    "power_status": device.power_status(),
                    "gpu_utilization": device.gpu_utilization(),
                    "memory_total_human": f"{round(device.memory_total() / 1024 / 1024)}MiB",
                    "memory_used_human": f"{round(device.memory_used() / 1024 / 1024)}MiB",
                    "memory_free_human": f"{round(device.memory_free() / 1024 / 1024)}MiB",
                    "memory_utilization": round(
                        device.memory_used() / device.memory_total() * 100, 2
                    ),
                }
            )
            now_processes = device.processes()
            sorted_pids = sorted(now_processes)
            for pid in sorted_pids:
                process = now_processes[pid]
                if process_type == "" or process_type in process.type:
                    processes.append(
                        {
                            "idx": i,
                            "pid": process.pid,
                            "username": process.username(),
                            "command": process.command(),
                            "type": process.type,
                            "gpu_memory": bytes2human(process.gpu_memory()),
                        }
                    )
        return JSONResponse(
            content={
                "code": 0,
                "data": {"count": ngpus, "devices": devices, "processes": processes},
            }
        )
    except Exception as e:
        return JSONResponse(
            content={"code": -1, "data": None, "error": str(e)}, status_code=500
        )


if __name__ == "__main__":
    port = int(os.environ.get("PORT", "8000"))
    uvicorn.run(app, host="127.0.0.1", port=port, reload=False)
代码中有 3 个环境变量:
SUBURL: 用于配置 api 的路径,比如指定为服务器名称之类的。FRP_PATH: frp 及其配置所在的路径,用于将 API 所在端口映射到我的校内小主机。如果你们的服务器可以直接访问到,那删掉相关函数,将最后一行改为0.0.0.0,之后通过 IP(或者另外给每个服务器配置域名)访问就行了。PORT: API 所在的端口。
这里我只写了两个接口 ||,实际也只用到了一个 ||
/count: 返回有多少给 GPU。/status: 返回具体的状态信息,返回数据可见下面的示例。不过这里我另外写了两个可选的参数:
idx: 逗号隔开数字,可以获得指定 GPU 的状态。process: 用于筛选返回的进程,我使用时直接设定为 C,只展示计算任务。
{
  "code": 0,
  "data": {
    "count": 2,
    "devices": [
      {
        "idx": 0,
        "fan_speed": 41,
        "temperature": 71,
        "power_status": "336W / 350W",
        "gpu_utilization": 100,
        "memory_total_human": "24576MiB",
        "memory_used_human": "18653MiB",
        "memory_free_human": "5501MiB",
        "memory_utilization": 75.9
      },
      {
        "idx": 1,
        "fan_speed": 39,
        "temperature": 67,
        "power_status": "322W / 350W",
        "gpu_utilization": 96,
        "memory_total_human": "24576MiB",
        "memory_used_human": "18669MiB",
        "memory_free_human": "5485MiB",
        "memory_utilization": 75.97
      }
    ],
    "processes": [
      {
        "idx": 0,
        "pid": 1741,
        "username": "gdm",
        "command": "/usr/lib/xorg/Xorg vt1 -displayfd 3 -auth /run/user/125/gdm/Xauthority -background none -noreset -keeptty -verbose 3",
        "type": "G",
        "gpu_memory": "4.46MiB"
      },
      {
        "idx": 0,
        "pid": 2249001,
        "username": "xxx",
        "command": "~/.conda/envs/torch/bin/python -u train.py",
        "type": "C",
        "gpu_memory": "18618MiB"
      },
      {
        "idx": 1,
        "pid": 1741,
        "username": "gdm",
        "command": "/usr/lib/xorg/Xorg vt1 -displayfd 3 -auth /run/user/125/gdm/Xauthority -background none -noreset -keeptty -verbose 3",
        "type": "G",
        "gpu_memory": "9.84MiB"
      },
      {
        "idx": 1,
        "pid": 1787,
        "username": "gdm",
        "command": "/usr/bin/gnome-shell",
        "type": "G",
        "gpu_memory": "6.07MiB"
      },
      {
        "idx": 1,
        "pid": 2249002,
        "username": "xxx",
        "command": "~/.conda/envs/torch/bin/python -u train.py",
        "type": "C",
        "gpu_memory": "18618MiB"
      }
    ]
  }
}
vue 实现的前端#
这里先偷个懒 ||,其实是因为不会 ||,暂时先照抄了原本用 Python 生成的 UI。
<!-- App.vue -->
<script setup>
import GpuMonitor from './components/GpuMonitor.vue';

let urls = [];
let titles = [];
for (let i = 1; i <= 5; i++) {
  urls.push(`https://xxxx/status?process=C`);
  titles.push(`s${i}`);
}
const data_length = 100; // GPU利用率历史数据长度,用于绘制折线图(先画个饼)
const sleep_time = 500;  // 间隔多久刷新一次数据,单位毫秒
</script>

<template>
  <h3><a href="https://www.do1e.cn/posts/citelab/server-help">服务器使用说明</a></h3>
  <GpuMonitor v-for="(url, index) in urls" :key="index" :url="url" :title="titles[index]" :data_length="data_length" :sleep_time="sleep_time" />
</template>

<style scoped>
body {
  margin-left: 20px;
  margin-right: 20px;
}
</style>
<!-- components/GpuMonitor.vue -->
<template>
  <div>
    <h1>{{ title }}</h1>
    <article class="markdown-body">
      <div v-for="device in data.data.devices" :key="device.idx">
        <b>GPU{{ device.idx }}: </b>
        <b>显存: </b>
        <div class="g-container">
          <div class="g-progress" :style="{ width: device.memory_utilization + '%' }"></div>
        </div>
        <code style="width: 25ch;">{{ device.memory_used_human }}/{{ device.memory_total_human }} {{ device.memory_utilization }}%</code>
        <b>利用率: </b>
        <div class="g-container">
          <div class="g-progress" :style="{ width: device.gpu_utilization + '%' }"></div>
        </div>
        <code style="width: 5ch;">{{ device.gpu_utilization }}%</code>
        <b>温度: </b>
        <code style="width: 4ch;">{{ device.temperature }}°C</code>
      </div>
      <table v-if="data.data.processes.length > 0">
        <thead>
          <tr><th>GPU</th><th>PID</th><th>User</th><th>Command</th><th>GPU Usage</th></tr>
        </thead>
        <tbody>
          <tr v-for="process in data.data.processes" :key="process.pid">
            <td>GPU{{ process.idx }}</td>
            <td>{{ process.pid }}</td>
            <td>{{ process.username }}</td>
            <td>{{ process.command }}</td>
            <td>{{ process.gpu_memory }}</td>
          </tr>
        </tbody>
      </table>
    </article>
  </div>
</template>

<script>
import axios from 'axios';
import { Chart, registerables } from 'chart.js';

Chart.register(...registerables);

export default {
  props: {
    url: String,
    title: String,
    data_length: Number,
    sleep_time: Number
  },
  data() {
    return {
      data: {
        code: 0,
        data: {
          count: 0,
          devices: [],
          processes: []
        }
      },
      gpuUtilHistory: {}
    };
  },
  mounted() {
    this.fetchData();
    this.interval = setInterval(this.fetchData, this.sleep_time);
  },
  beforeDestroy() {
    clearInterval(this.interval);
  },
  methods: {
    fetchData() {
      axios.get(this.url)
        .then(response => {
          if (response.data.code !== 0) {
            console.error('Error fetching GPU data:', response.data);
            return;
          }
          this.data = response.data;
          for (let device of this.data.data.devices) {
            if (!this.gpuUtilHistory[device.idx]) {
              this.gpuUtilHistory[device.idx] = Array(this.data_length).fill(0);
            }
            this.gpuUtilHistory[device.idx].push(device.gpu_utilization);
            this.gpuUtilHistory[device.idx].shift();
          }
        })
        .catch(error => {
          console.error('Error fetching GPU data:', error);
        });
    }
  }
};
</script>

<style>
.g-container {
  width: 200px;
  height: 15px;
  border-radius: 3px;
  background: #eeeeee;
  display: inline-block;
}
.g-progress {
  height: inherit;
  border-radius: 3px 0 0 3px;
  background: #6e9bc5;
}
code {
  display: inline-block;
  text-align: right;
  background-color: #ffffff !important;
}
</style>
// main.js
import { createApp } from 'vue'
import App from './App.vue'

createApp(App).mount('#app')
<!DOCTYPE html>
<html lang="">
  <head>
    <meta charset="UTF-8">
    <link rel="icon" href="/favicon.ico">
    <meta name="viewport" content="width=device-width, initial-scale=1.0">
    <link rel="stylesheet" href="https://cdnjs.cloudflare.com/ajax/libs/github-markdown-css/5.2.0/github-markdown.min.css">
    <title>实验室GPU使用情况</title>
  </head>
  <body>
    <div id="app"></div>
    <script type="module" src="/src/main.js"></script>
  </body>
</html>
npm run build 顺利拿到 release 的文件,把 nginx 的 root 配置到该文件夹下就大功告成了。
实现的效果: https://nvtop.njucite.cn/
虽然 UI 还是一样的丑,但是至少可以动态刷新了,好耶!
新 UI#
先把饼画在这里,待我学成归来。( ̄_, ̄)
[x] 更美观的 UI(这一点有没有达成我也不确定了,我是设计的废物)
[x] 增加利用率折线图
[x] 支持夜间模式
2024/12/27:使用 nextjs 把上面的 TODO 都完成了,此外还实现了隐藏部分主机的功能,并将隐藏主机设定为 cookie,方便下次再打开时展示相同的状态。
2025/03/11:nextjs 更新了邮箱登录功能,仅限授权用户访问。
2025/09/18:把代码整理了一下,现在功能基本完善并且方便其他人直接部署了。
完整代码见:
Github Repo not found
The embedded github repo could not be found…
Github Repo not found
The embedded github repo could not be found…